Google Analytics is a free product available from Google and (provided your site has the proper Analytics tracking code installed), keeps track of web traffic in great detail, including an option for “Real-Time” data (still in BETA).
Components of Google Analytics
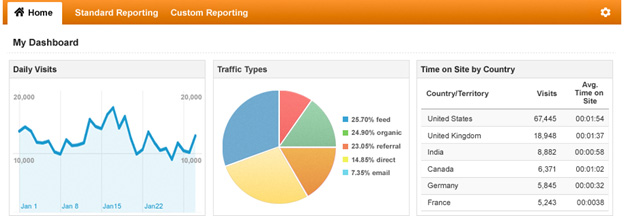
When you log into Google Analytics, you’re typically shown your “dashboard” which includes a chart along with some key stats.
- Visits
- Unique Visitors
- Pageviews
- Pages / Visit
- Avg. Visit Duration
- Bounce Rate
- % New Visits
These stats appear on the dashboard for a reason: they’re important! So, what do they really mean?
- Visits
A Visit is simply the number of visitors your site has received during the specified period. - Unique Visitors
Out of those visitors, Google keeps track on how many were “unique” based on the end-user’s IP address (Internet Protocol). This number may be a little skewed if the same user has DSL for example and is issued a different IP address by their ISP every time they cycle their modem or logs on to the Internet; or if the user clears their browser’s cookies. - Pageviews
This number represents the total number of pages that were viewed by all visitors during the specified time. - Pages / Visit
If you divide the Pageviews by the Visits, you’ll get the number of pages each visitor navigates to during their experience with your site. For example, if you had 2,248 Pageviews and 921 Visitors, you get a Pages / Visit of 2.44 (2,248 ÷ 921 = 2.44) - Avg. Visit Duration
Taking into account the number of visitors to you site, Google Analytics displays the Average Visit Duration – or the average time each visitor has spent on your site. - Bounce Rate
Bounce Rate is an important element in determining how “sticky” and relative your landing page(s) are. The Bounce Rate is the percentage of visitors that see only one page during a visit to your site. There are a number of reasons why the Bounce Rate may be high. For example, visitors might leave your site from the entrance page in response to the site design or usability issues. Or, it might be that just certain pages on your site have a high Bounce Rate for very valid reasons, such as- ◦Single Page Sites
Google doesn’t register multiple Pageviews unless visitors reload that page. As a result, single-page sites tend to have high bounce rates. - Contact information / location information
If a visitor goes to a landing page (the contact page for example) to obtain the address or phone number and then leaves, this is considered a bounce. - User Login
If you have a login option on the homepage and the user clicks on it, this is considered a bounce if that login page does not have the tracking code installed on it. - User behavior
If a user bookmarks a page on your site, visits it and leaves, then that’s considered a Bounce. - % New Visits
This is the percentage of visits Google deems as “new”. For example, if a visitor to your site did not have your site’s Google Analytics’ cookies when they hit the first page of their visit, this would be considered a New Visit. Additionally, should a visitor delete their cookies and come back to the site, they would also be counted as a new visitor.
- ◦Single Page Sites
The Difference between “Exit Rate” and “Bounce Rate”
To understand the difference between exit and bounce rates for a particular page in your site, keep in mind three things:
- For all Pageviews to the page, the exit rate is the percentage that were the last in the session.
- For all sessions that start with the page, bounce rate is the percentage that were the only one of the session.
- The bounce rate calculation for a page is based only on visits that start with that page.
For example, your site has pages A through C, and only one session per day exists, with the following Pageview order:
- Monday: Page A > Page B > Page C
- Tuesday: Page B > Page A > Page C
- Wednesday: Page A > exit
The content report for Page A would show 3 Pageviews and a 50% bounce rate. You might have guessed that the bounce rate would be 33%, but the Tuesday Pageview granted to Page A is not considered in its bounce rate calculation. Consider that a bounce is the notion of a session with only one interaction from the visitor, and the session-centric analysis answers a simple yes/no question: “Did this session contain more than one Pageview?” If the answer to that question is “no,” then it’s important to consider which page was involved in the bounce. If the answer is “yes,” then it only matters that the initial page in the session lead to other Pageviews. For that reason, bounce rate for a page is only meaningful when it initiates the session.
Now let’s extend this example to explore the Exit rate and Bounce rate metrics for a series of single-session days on your site.
- Monday: Page B > Page A > Page C
- Tuesday: Page B > Exit
- Wednesday: Page A > Page C > Page B
- Thursday: Page C > Exit
- Friday: Page B > Page C > Page A
The % Exit and Bounce rate calculations are:
- Exit Rate:
- Page A: 33% (only 3 of 5 sessions included Page A)
- Page B: 50% (only 4 of 5 sessions included Page B)
- Page C: 50% (only 4 of 5 sessions included Page C)
- Bounce Rate:
- Page A: 0% (no sessions began with Page A, so it has no bounce rate)
- Page B: 33% (bounce rate is higher than exit rate, because 3 sessions started with Page B, with one leading to a bounce)
- Page C: 100% (one session started with Page C, and it lead to a bounce)
Overview of Google Analytics:
Google Analytics tracks the following kinds of data about how visitors interact with your site and its content:
- The pages on which they enter and exit your site.
- How often and how long they view individual pages.
- The extent to which they search your site for specific content.
- The extent to which they interact with things like slide shows or embedded videos.
Based on this data, you can develop an understanding of how well your content addresses the purpose of your site (for example, to sell high-end luxury real estate).
If your landing pages have a high bounce rate and visitors spend only a few seconds on those pages, you might conclude that the page content does not meet visitors’ expectations, or that the page isn’t designed to effectively draw visitors further into your site.
On the other hand, if a great percentage of visitors are leaving your site from the page that concludes a transaction, you can infer that your site design is working in your favor.
If users tend to search your site more often than you anticipate, you might consider redesigning the site navigation.
When looking at the data from Analytics (and there’s a lot of data), understand and treat the data as a “report card” of your site. There are things that one could do to improve the overall numbers; however, if goal conversion is your objective, concentrate on the user’s experience to improve the conversion rate.